
Recent Publications
- Glacier shrinkage and slope processes create habitat at high elevation and microrefugia across treeline for alpine plants during warm stages
- The Late Holocene tephra record of the central Mediterranean Sea: Mappingoccurrences andnewpotential isochrons for the 4.4–2.0 ka time interval
- Evidence for a link between the Atlantic Multidecadal Oscillation and annual asthma mortality rates in the US
- Climate variability of the last ~2700 years in the Southern Adriatic Sea: Coccolithophore evidences
User login
You are here
Terrestrial biodiversity in the north-western Italian Alps
Mountain ecosystems generally show high biodiversity levels and are characterised by species with particular adaptations to high altitude and low temperatures, making them potentially more sensitive to climatic and environmental variations.
The European Alps reflect a complex physical history and have a long history of human presence and exploitation. This complexity leads to a rich diversity of habitats and landscapes, which host a large number of plants and animals. Alpine regions host about 30 000 animal species and 13 000 plant species, representing one of the most important regions for the preservation of biodiversity in Europe.
During the last century, decreases in biodiversity have been progressively more evident: the amount of species loss is greater now than at any time in human history. This has seriously affected all biodiversity levels, reducing the benefits provided to human populations.
The observed current loss of biodiversity requires careful and repeated monitoring of the distribution of living organisms, particularly in mountains.
In this framework, this pilot study is devoted to apply and improve monitoring and data storage methodologies, and to explore the relationships between animal biodiversity, climate and land use at different spatial scales in alpine protected areas. The long-term purpose of the study is to create an historical dataset, also on the basis of already existing data.
Research activities have been carried out in fixed plots, already subjected to repeated monitoring in 2007-2008. They represent the implementation and continuation of a previous existing in situ project, promoted by Gran Paradiso National Park in 2006 (www.pngp.it/en/nature-and-research/consevation-and-research/wildlife-research) and continued through the cooperation between ISAC-CNR and other two protected areas in NW Italian Alps, the Orsiera Rocciavré Natural Park and the Veglia Devero Natural Park in the framework of the Project of Interest NextData.
13 altitudinal transects were established, covering an altitudinal range from 500 to 2700 m a.s.l. and interesting three vegetation belts (montane, subalpine, alpine). Sampling units are circular plots with a radius of 100 m, for a total of 75 sampling stations. In the plots, monitoring activities have been carried out to provide presence/absence and relative abundance data of species belonging to taxa selected as bio-indicators.
A biodiversity indicator (bio-indicator) is a taxon or a functional group, whose diversity can be used to make inference about the diversity of other taxa or the habitat or the entire ecosystem in which they live. To be useful, bio-indicators should comply with a priori suitability criteria: easiness of sampling, cost-efficacy, taxonomic and basic ecological knowledge. Selected taxa for this study are: butterflies (Lepidoptera Rhopalocera), crickets and grasshoppers (Orthoptera), birds, surface-active macro-arthropods (Coleoptera Carabidae, Coleoptera Staphylinidae, Araneae, Formicidae).
For each taxonomic group we used semi-quantitative census techniques that are, as much as possible, easy to apply, standardized, cheap and repeatable. Birds were censused by means of point counts and each plot was visited twice during the reproductive season. We sampled butterflies and grasshoppers/crickets using walking transects along the diameter of the plot (200 m in length), walked at uniform speed. We collected surface-active arthropods using pitfall traps (plastic cups, diameter of 7 cm, filled with 10 cc of white vinegar).
Monitoring activities concerned also the collection of: microclimatic data, through the positioning of temperature data-loggers (iButton DS1922), one per each sampling station (plot); macro-environmental (topographic variables) and micro-environmental parameters (percentage of land coverage and estimate of floristic diversity).
First year - results. The results obtained during the first year are the organisation in a database of the data coming from the previous monitoring campaigns (2007-2008), and their statistical analysis. The data will then be compared with those which we are currently collecting in the framework of NextData (2012-2013).
The biological datasets coming from the monitoring activities started in 2007 have been analysed to describe biodiversity patterns in mountain ecosystems and to identify the most vulnerable habitats and species. The results of the analysis showed that species richness displays a unimodal pattern along the altitudinal gradient, with a peak at medium elevations, while vulnerable and endemic species increase in a monotonic way along the altitudinal gradient (Fig. 1). Consequently, we observed that the alpine belt, in comparison with belts located at lower altitude, shows lower values of species richness, but a higher percentage of species of conservation interest (e.g., microthermic species, highly specialized species with low dispersal capability, rare species). Moreover, species richness and community composition of arthropods are highly influenced by micro-climate, suggesting their potential vulnerability to temperature changes.
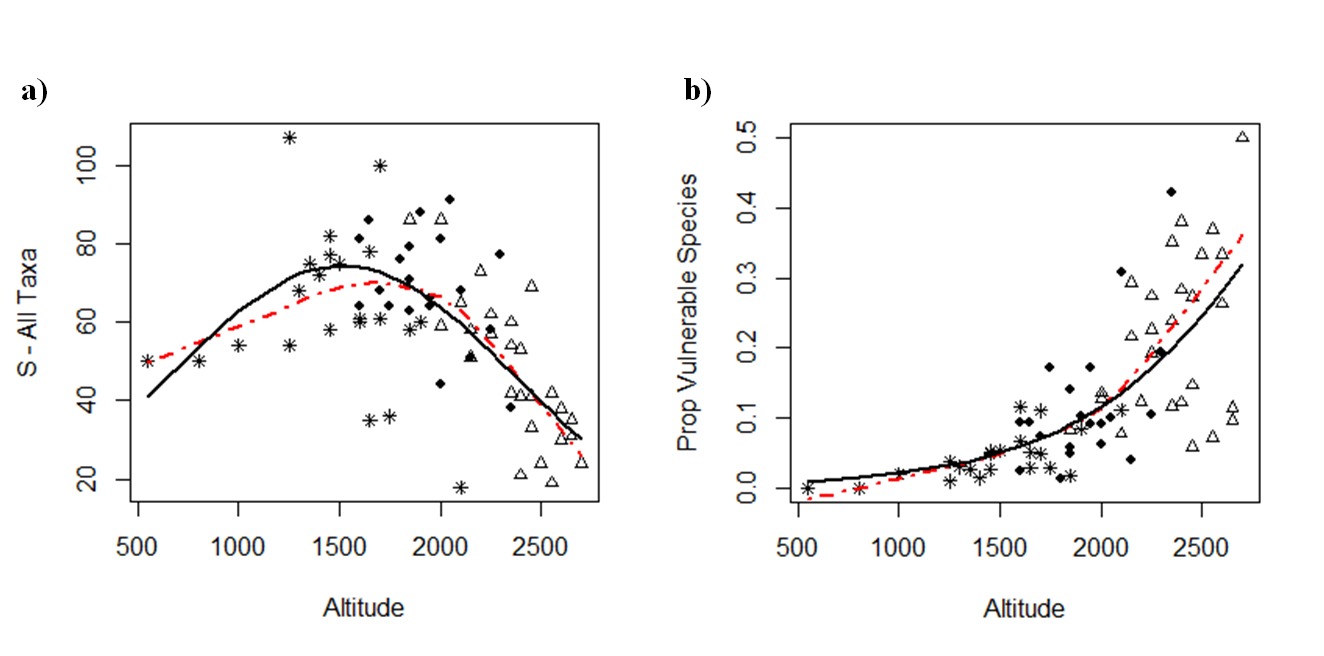
Fig. 1. Scatterplots of the total species richness per site, for all taxonomic group pooled together (a), and of the proportion of vulnerable species (b) along the altitudinal gradient. The LOWESS regression curve is represented as a dashed line, while the regression curve obtained from the best model is represented as a solid line. Montane belt (*), Subalpine belt (●), Alpine belt (▲).
We are performing model simulation of these biological datasets using MaxEnt software. Our preliminary simulations, following a moderate increase of temperature (1°C), showed that: the temperature increase, even if small, determines changes in the observed biodiversity patterns; the amount of change in distribution patterns as a consequence of temperature increase differ among species, depending on the taxonomic group and the degree of specialization; the alpine belt could be that which is most influenced by temperature variations, in particular through the gain of species coming from lower altitude and the loss of typical species (e.g., endemic and/or strictly associated with high altitude). High altitude communities could become more similar to present lower altitude communities (Fig. 2); the minimum temperature seems to exert a more important role in determining biodiversity patterns than mean and maximum values.
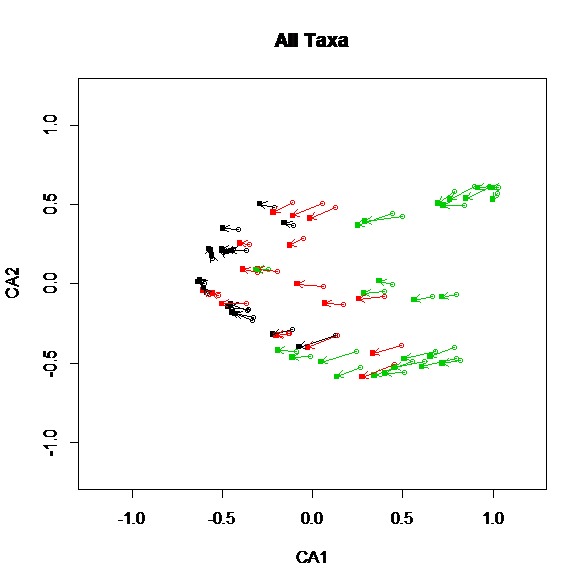
Fig. 2. Correspondence Analysis for all taxonomic group pooled together. Open circles indicate the present situation and filled squares indicate projected results from Maxent simulations. Arrows indicate the shift of each plot. Different colours indicate different vegetation belts (black=montane, red=subalpine, green=alpine). The first axis is positively correlated with altitude and negatively correlated with minimum temperature.
![]()
![]()
![]()
![]()
![]()
![]()
![]()
![]()
![]()
![]()
![]()
![]()
![]()
![]()
![]()
![]()
![]()
![]()
![]()
![]()
![]()
![]()
![]()
![]()
![]()
![]()
![]()
![]()

