NextSnow aims at setting the ground for a snow cover and snowfall measurement and modeling strategy in Italian mountain regions using ground measurements, remote sensing observations and numerical models. Data from ground networks of snow cover and snowfall measurement sensors are completed by advanced techniques for determining the characteristics of the snow mantle and of the mass and energy fluxes at the air-snow and soil-snow interface. Satellite data monitor wider areas for hydrologic and climate applications. The modeling of the snow cover and of the energy and water balance within the snow mantle are essential for meteorological, hydrological and climate modeling. The rescue and the digitization of the climatic variables from meteorological stations in the NW Alps in the last 100 years provide information on climate change and extreme events. The project concentrates on the North Western Alps as a pilot project.
NextSnow aims at
1) making available datasets and with error characterization,
2) monitoring both from satellite and at ground level, and
3) modeling the observed parameters and the snow mantle.
Extensive (spatially and temporally) snow datasets on the Alps for meteorological, hydrological and climate applications are necessary, only partially available and somehow scattered over the territory. An observation strategy needs to be setup and extended in the future from the NW pilot region of the project to the rest of the Alpine chain. Long-term nivometric homogeneous data series are to be developed for the identification of trends and future scenarios and of extreme events. The second overarching goal is to develop and test models of snow depth (HS), snow water equivalent (SWE), air-snow exchanges, and energy and water balance within the snow mantle. These models and the resulting parameterizations are instrumental for meteorological, hydrological and climate modeling applications.
ARPA-Valle d’Aosta has recently produced datasets of meteorological measurements from the eddy-covariance station of Torgnon (AO) and analysed the dataset of SWE simulations over the entire territory of the Valle d’Aosta region (weekly simulations over the 2002-2014 period). The data represent a first important contribution to the construction of a dataset of snow cover over the alpine region for climatological and hydrological purposes. The dataset consists of data of HS, SWE and density of the snow mantle over the period 2005-2014 (over 6100 data) made available by ARPA-VdA, the Centro Funzionale regionale and the Ufficio Neve e Valanghe. The data are validated and error figures are provided. Their possible integration with those from the Piemonte region will provide the project scientists with a dataset of considerable length and accuracy to be complemented by the satellite observations. Figure 1 shows the seasonal evolution of SWE and its anomalies over Valle d’Aosta between 2002 and 2014. At the same time the CIMA Foundation has produced the MODIS and H-SAF dataset of snow cover, which will be integrated by the in situ and helicopter measurements for setting up a high resolution and long dataset to start verifying the performance of the snow cover retrieval algorithms, and the characteristics of the numerical models and their relative performances.
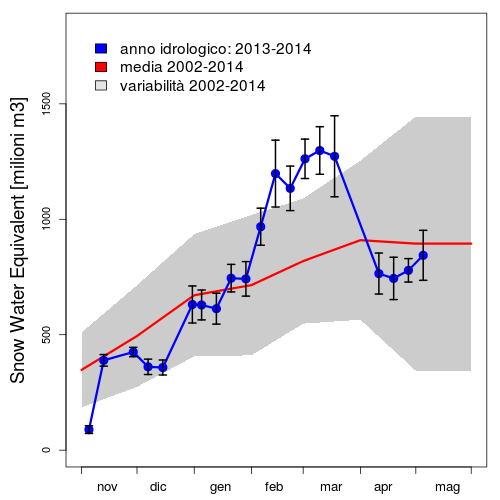
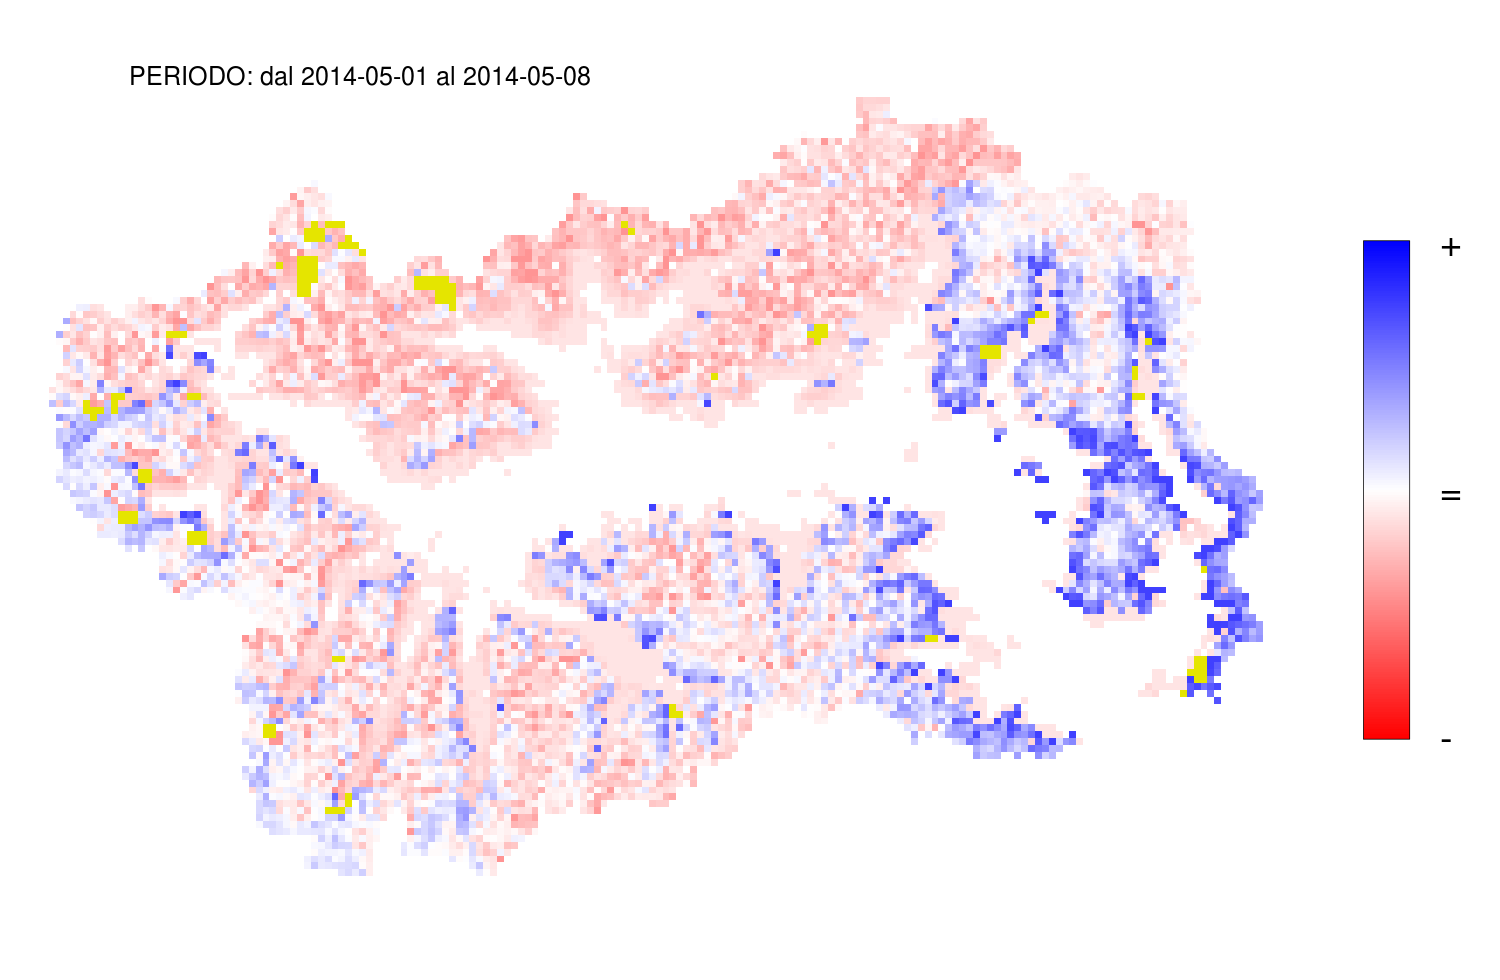
Figure 1. Seasonal evolution of SWE (left) and anomaly of a specific simulation with respect to historical background over the same period over Valle d’Aosta (right). [Data Centro Funzionale della Valle d’Aosta and ARPA-VdA, analysis by ARPA-VdA]
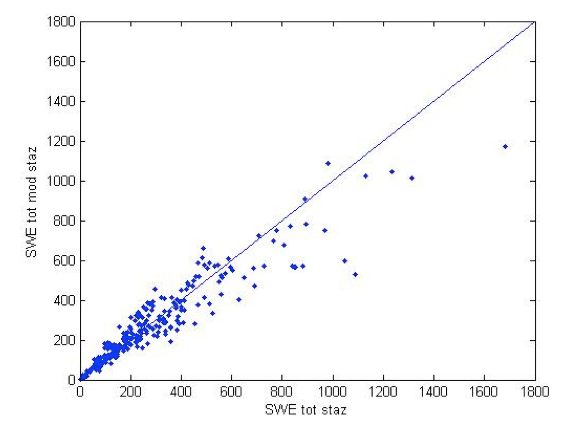
A dataset of fresh snow measurements at 65 high altitude station in Valle d’Aosta and Piemonte was created by Polytechnic of Torino-DIATI accompanied by in situ measurements of meteorological variables and of snowfall characteristics; this dataset will be used to study the relationships between the snowfall and the meteorological conditions during the snowfall event. Note that actual measurements from nivological networks do not take into account the meteorological conditions and are thus subject to considerable errors that need to be determined. Figure 2 shows the scattergram of the seasonal SWE totals as measured and reconstructed by a snow model that considers the meteorological conditions over the measuring site.
Figure 2. Comparison between total seasonal SWE as measured and reconstructed by a model for all seasons and for all measuring sites in Valle d’Aosta e Piemonte. [Data and analysis by Polytechnic of Torino-DIATI]
The Polytechnic and University of Torino-DIST has set up the measuring site in Cogne (AO) and conducted a measurement campaign from autumn 2010 till now. Measurements were carried out with Time Domain Reflectometry (TDR, soil moisture and snow density), Thermal Infrared sensors (TIR, soil and snow temperature) and eddy covariance sensors (sensible and latent heat fluxes) over highly sloped terrain exposed to solar radiation. The measurements will allow for improving the reliability of snow cover products on mountain slopes whose exposure to solar radiation has strong influences on the evolution of the snow cover. Several fusion snow transients were analysed. An example of the measurements in November 2012 is shown in Figure 3.
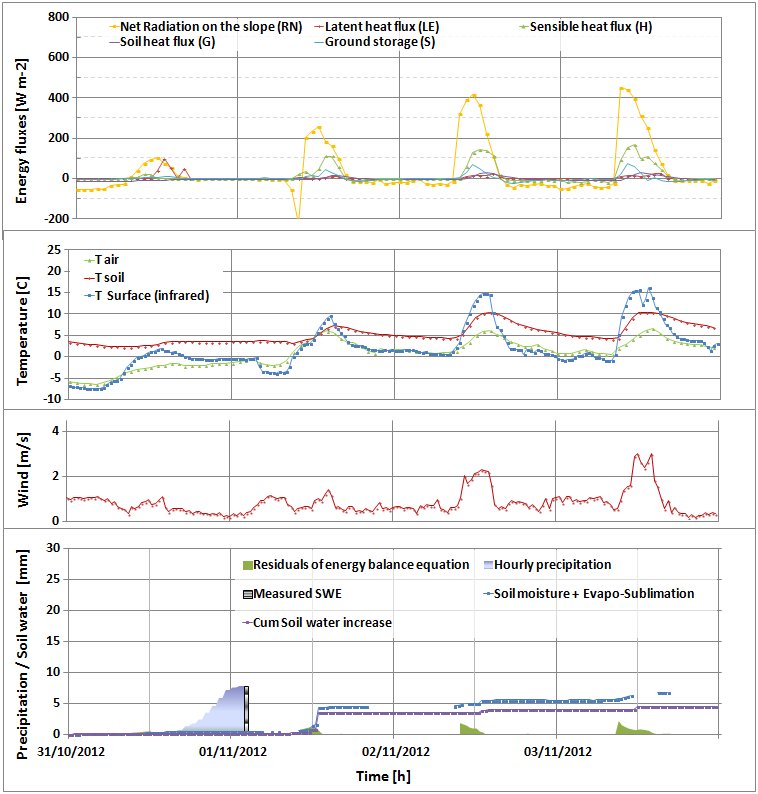
Figure 3. Micrometeorological and soil characteristics measurements at Cogne (AO) in November 2012. [Data and analysis by Polytechnic and University of Torino-DIST]
Two activities are carried out by the Department of Physics of the University of Torino: a) set up of the necessary dataset for the initialization of the UTOPIA model that will be used over Valle d’Aosta during the project, and b) verification of the parameterizations of the snow mantle within the model.
The Department of Earth Sciences of the University of Torino has retrieved and analyzed the climatic snow data from manual and automatic stations over a long period of time (1961-2010) over Piemonte. In particular, the data were quality controlled and homogeneized so as to obtain correct trends, climatic indexes and extreme events.
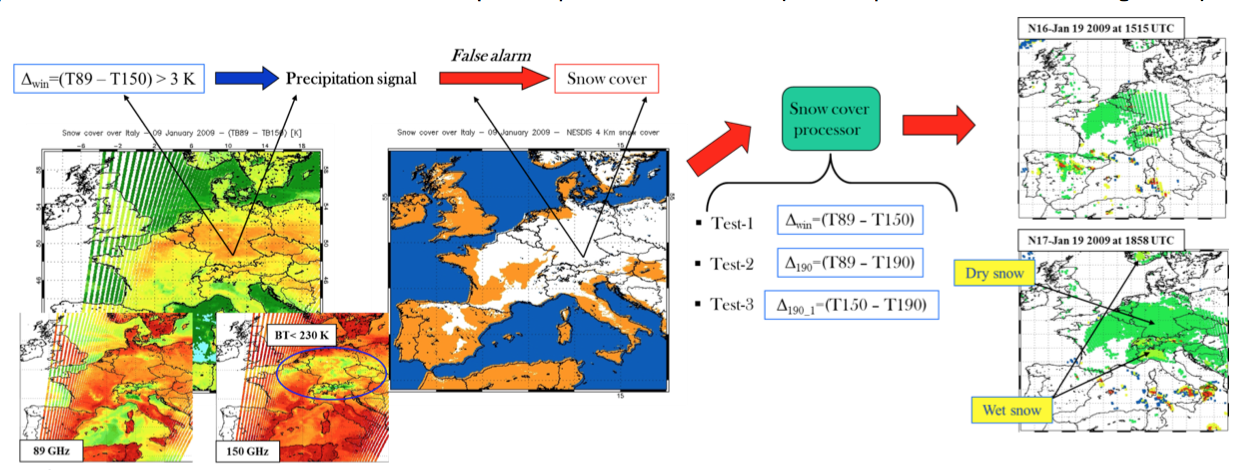
CNR-ISAC has improved the algorithm Water vapour Strong Lines at 183 GHz (183-WSL) for the retrieval of precipitation and snow cover (Figure 4). A new software module was added for cloud classification based on sensitivity thresholds of the microwave channels, which improves the actual performance of the algorithm both in cloud classification and snow cover detection, this latter performed by a digital elevation model (DEM).
Figure 4. Block diagram of the microwave algorithm 183-WSL for precipitation estimation and snow cover retrieval based on the 89, 150 and 183 GHz channels of actual constellation of satellite sensors. [CNR-ISAC]